

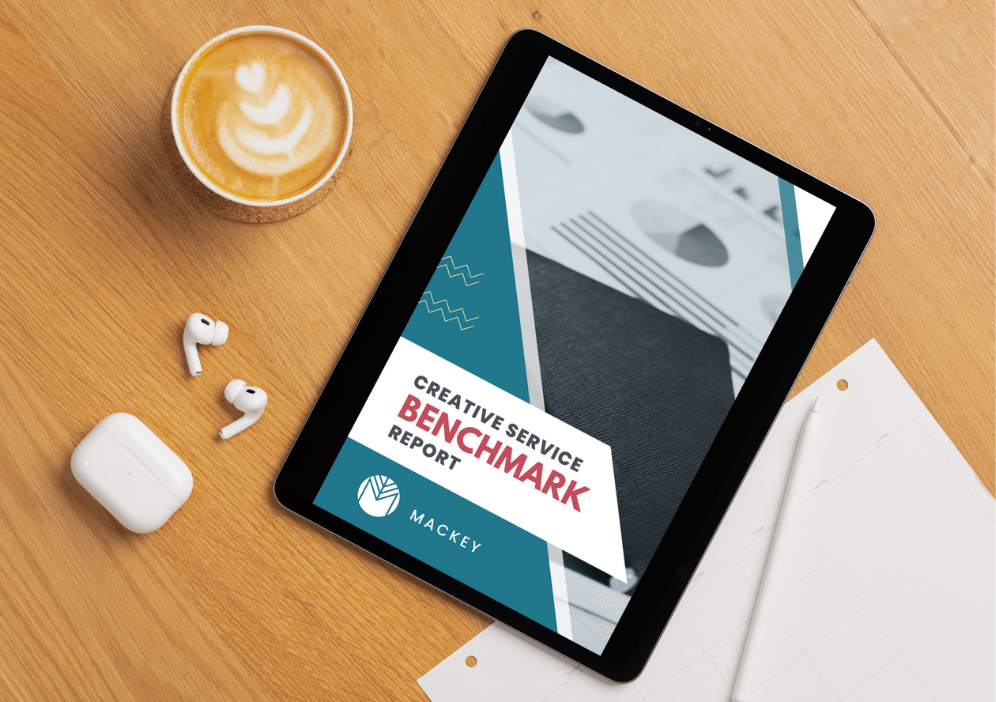
2025 Creative Service Benchmark Report

DISCOVER WHERE YOU STAND IN THE CREATIVE INTDUSTRY
As a creative agency owner, wouldn't you like to know exactly how your business measures up financially against others in the industry?
Now you can, with MACKEY's comprehensive Creative Services Benchmark Survey.
What You'll Gain
-
Free Customized Benchmark Report
Get a 360-degree view of your financial position compared to similar creative agencies.
-

Exclusive Coaching Session
Gain expert insights with a complimentary 30-minute consultation with on of our CFO Coaches.
-

Access to The Prosperity Playbook Online
Leverage our premier learning platform free for 6-months, packed with financial tools and resources tailored for creative businesses.
What You’ll Discover
We’re not interested in data for the sake of data.
We're diving deep into the key metrics that drive profitability in creative services.
But here's the exciting part: we're not just collecting data — we're transforming it into actionable insights. You'll receive a personalized report that doesn't just show where you stand — it explains why it matters. We'll break down each metric, showing you how it impacts your business and how you can leverage it for growth.
Just some of what we’re exploring
-
Is your business skyrocketing or steady? We'll show you how your growth compares and what it means for your future.
-
The lifeblood of profitability. Discover if you're maximizing your earning potential on each project.
-
Are you charging what you're worth? See how your rates stack up and learn strategies for optimizing them.
-
The ultimate efficiency metric. Find out if you're getting the most bang for your payroll buck.
-
Quality over quantity? We'll help you understand if your client portfolio is structured for maximum profitability.
-
The bottom line of your bottom line. See where you land and get tips to boost your profits.
-
Cash flow is king! Learn how quickly you're getting paid compared to others and why it matters.
Take the survey now and discover where you truly stand — but more importantly, how to STAND OUT.
At MACKEY, we’re more than just a fractional CFO and accounting firm—we’re your strategic partner in transformation. We eliminate fear, forge deep connections, and provide the clarity you need to move forward with confidence. Our approach goes beyond numbers; we focus on guiding your business to lasting growth while enhancing the lives of those around you. With our full-service executive guidance, we empower you to thrive, embrace change, and lead with impact.
ABOUT MACKEY
WHY CHOOSE MACKEY?
Expert Fractional CFO Services
Gain insights from experienced CFOs who understand your business and guide you toward financial clarity.
Custom Accounting Solutions
Tailored accounting services that align with your goals, freeing you to focus on growth.
Proven Track Record
Trusted by businesses nationwide to deliver measurable results and drive success.
FAQ
-
The survey takes approximately 15 minutes to complete once you’ve gathered the required data.
-
Most of the information we are requesting can be pulled straight from your Profit & Loss statement. We’ve worked hard to make data collection as straight forward as possible.
Financial data set list:
Total Revenue/Income/Sales (Last 12 Months)
Total Revenue/Income/Sales (Prior 12 Months)
Total Net Income/Profit (Last 12 Months)
Total Wages & Salaries (Last 12 Months)
Total Contractor Fees (Last 12 Months)
Total Pass-Through Client Costs (Last 12 Months) – Anything directly related to a client project, i.e., ad spend, venue rentals, merchandise, giveaways, etc. that would then be billed to the client
# of Owners/Partners – Include those who have an equity stake in the business
Total Owner/Partner Salaries (Last 12 Months) – Do not include distributions
Total # of Hours Worked – All Employees (Last 12 Months)
Total # of Hours Billed – All Employees (Last 12 Months)
Total # of Hours Worked – Administrative Employees Only (Last 12 Months)
Total # of Hours Billed – Administrative Employees Only (Last 12 Months)
# of Client Groups (Average Last 12 Months) – As an example, Procter & Gamble, which has many strategic business units (SBUs) aligned with its brands but should be considered just one client group (all SBUs are rolled into the one client group)
Current Accounts Receivable Balance
% of Total Revenue Generated from Retainer/Recurring Fees
-
The survey will close for participation in December and reports will be sent out in the first quarter of 2025.
-
Absolutely. Your individual responses are kept strictly confidential and will only used in aggregate for benchmarking purposes.
Your individual responses will only be shared with you in your private, individually customized report.
-
Yes, MACKEY is performing and publishing this survey independently and not in conjunction with any other businesses, advisors, or entities.
… and no. In the interest of full transparency, MACKEY has brought on a research partner, CLARITY Research & Strategy to build and administer the survey to ensure the highest standards of confidentiality & quality are met.